Photo: Stephen Phillips
Using data to inform content strategy
Data and insights are at the heart of good business decisions but finding the time can be a challenge. Curiosity and incremental learning could be the answer, says Zosia Poulter.
Any kind of strategy – be it a long-term integrated organisational strategy or a practical digital content strategy – needs to be underpinned by facts about your audience, your finances, your people, your goals and your processes.
But understanding data can be intimidating. Outside the sector, you’re more likely to find roles or whole teams dedicated to data analysis. The reality in the arts is slightly different.
The required skillset for many arts jobs is multi-faceted. Understanding and interpreting data is often a secondary part of a role and often doesn’t come naturally. This is no surprise – the sector’s digital skills gap has been well reported over the last decade.
Practising an experimental mindset
For people working in a digital or marketing team, the skills and digital knowledge required are constantly growing. With new platforms and technologies popping up every five minutes, against a backdrop of job insecurity and AI on the rise, it’s no wonder the sector has faced challenges recruiting.
The outlook feels challenging. But developing good data and analytics practices is as much about having the skills, knowledge and technical infrastructure in place as it is about building an experimental mindset, according to a recent study by McKinsey. And the positive news is that experimentation and creativity is the stuff we’re good at as a sector.
A wealth of data at our fingertips
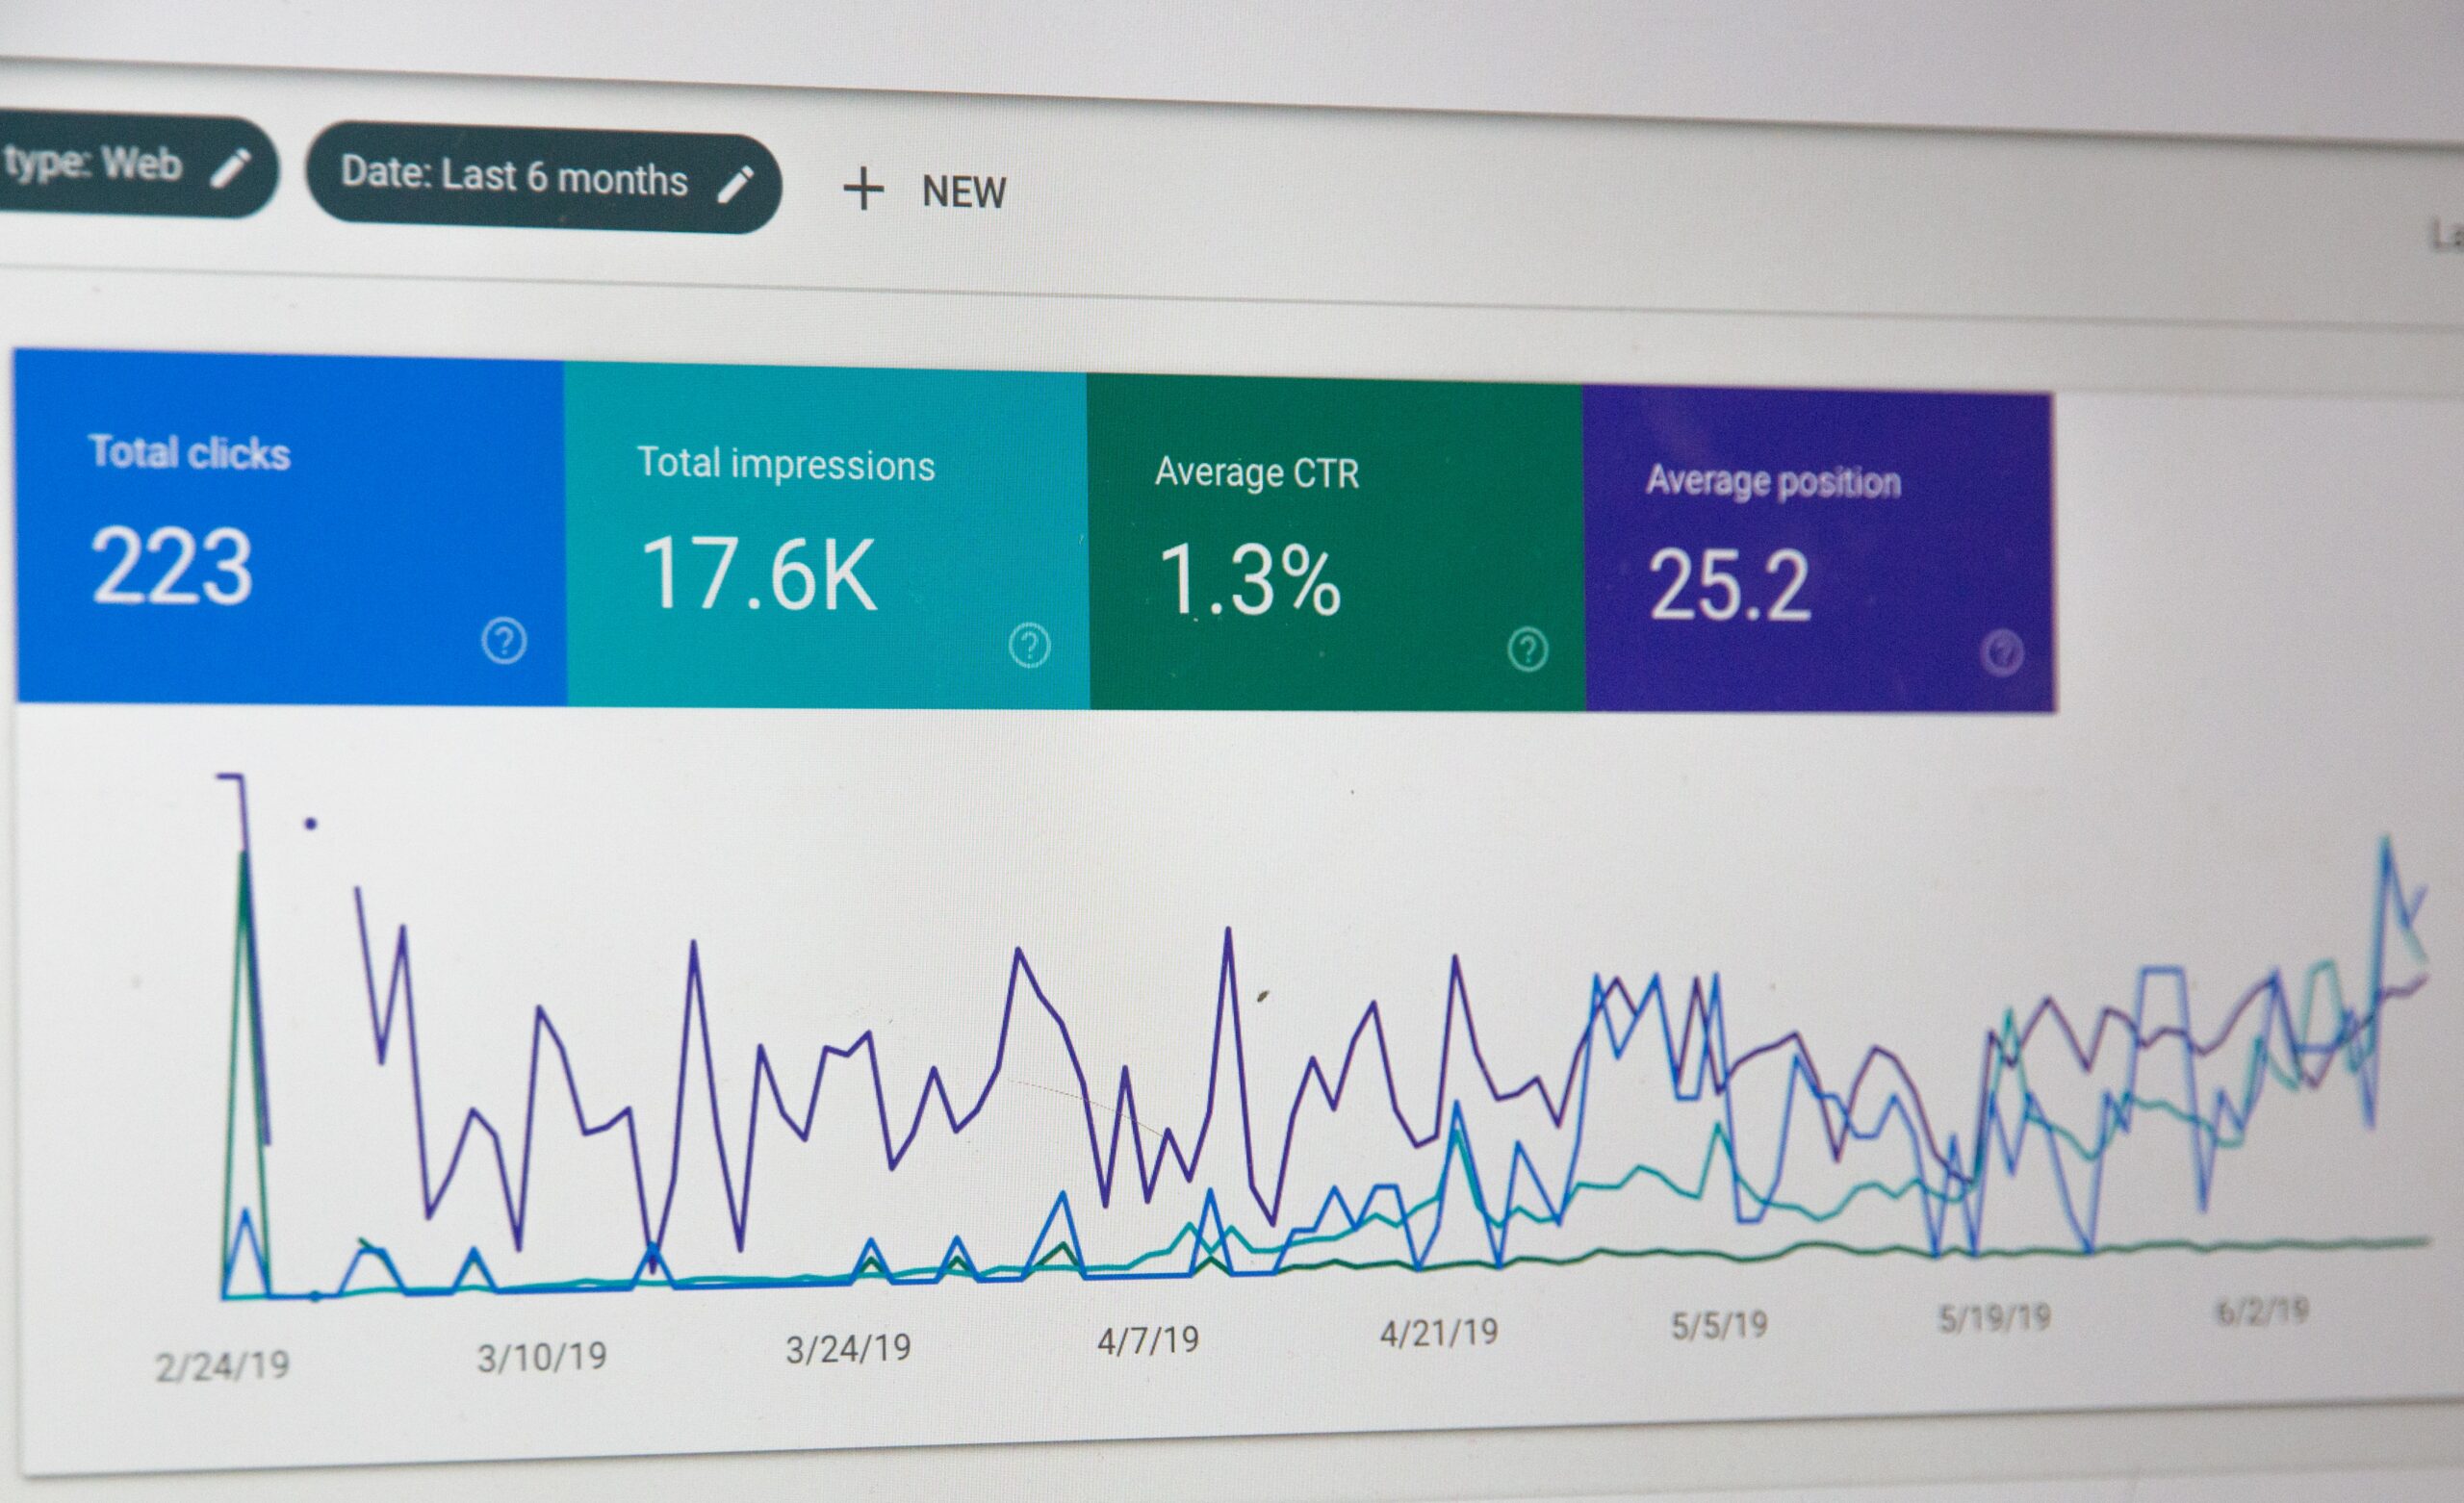
As marketeers, we have access to a huge amount of untapped data about our content. This data isn’t just intangible numbers – it’s stories about our audience needs, preferences and behaviours. The steady flow of data to platforms like Google Analytics and Search Console arguably makes marketing teams more equipped than any other department at understanding their audiences.
Data and insight maturity is different for every organisation. Small ones might have data tracking set up with access to the relevant platforms but lack the resources to consider the data meaningfully. Bigger or more data savvy ones might have dashboards established that regularly monitor key website metrics – number of new users, sessions, page views, revenue from ticket sales and so on.
This is useful and a good start, but it’s easy to get complacent with dashboards and they often lack the necessary context to make the data meaningful in a more granular way. For example, the data might tell me that in comparison to this quarter last year, revenue from ticket sales is down by 50%. But what the data doesn’t account for is the specific context of the previous year’s big sell-out show.
Start with specific questions
Regardless of how mature an organisation’s data practices are, it’s crucial to start any data analysis with clear questions. What specific thing are you looking to find out? And how will you use the answer to inform your strategy?
Clear questions force you to segment and compare data in more definitive ways. We recently conducted an analysis of 30 blogs from performing arts organisations in response to some common client questions such as:
● What should we call our blog? Does it matter?
● Do blogs need to be accessible from the main navigation?
● How do people find blog content? What do they do next?
● What content performs well?
Starting with an explicit set of questions helped to shape what data we pulled and analysed. Using a mix of Google Analytics and publicly available data we compiled a range of information to understand trends, similarities and differences in blog content across the sector.
The study produced some useful and applicable insights about audience behaviours and the sector's content practices. But more interestingly, the process highlighted an obvious truth. That we’re not looking at the data enough. As a sector, we’re caught in a cycle of producing and publishing digital content without much nuanced insight into how it’s being used.
Data can help you unpick the truth about an explicit user journey, an area of the website or a content type. Using tools like Google Search Console and Google Analytics you can identify things like what search terms people are using, how users find your content, whether they take any action, how long they stay on a page. Using these tools alongside carrying out an audit or review of the content can reveal even more subtle findings.
In our research we looked at 90 blogposts (three from each of the 30 organisations involved) and found that 55% of users were exiting the website after engaging with the content. However, a further audit of those 90 blogposts found that 46% didn’t include a clear call-to-action. Layering data like this is where the nuance lies (we’ll be talking all about the findings from our research in this upcoming webinar).
Aim for an iterative approach
Getting into data isn’t really about numbers. It’s about being curious and asking questions. The chances are, you won’t instinctively know how to pull and cut the data to get the answers you need. But there are YouTube videos, webinars, consultants and networks you can lean on for help. And proactively upskilling is going to be more important than ever as GA4 sets to replace Universal Analytics in the coming months.
Carving out time is always going to be a challenge. But digging into data can be hugely rewarding. Echoing the McKinsey report, it’s not about aiming for perfection, it’s about building a practice of learning and iteration.
Zosia Poulter is Content Strategist at Substrakt.
![]() www.substrakt.com
www.substrakt.com
![]() @substrakt
@substrakt
This article is part of a series contributed by Substrakt exploring the many ways in which arts and cultural organisations can embrace the world of digital.
Join the Discussion
You must be logged in to post a comment.